
Market Review
US stocks, as measured by the S&P 500, rebounded in Q2 2025, up 10.9% for the year. This erased the loss in Q1, bringing the year-to-date return for 2025 to 6.2%. International stocks, as measured by the EAFE Index, fared better, up 11.8% for the quarter and up 19.5% for the year. It is important to note that international stocks are priced in foreign currency, so if the US dollar (USD) declines in value, the international stock prices increase. Year to date, USD declined by 10.7%. Thus, over half of the increase in international stocks is a direct result of the depreciating USD.
This decline of the USD has been the steepest since 1973. We are only noting data since 1973 because this is when the USD went off the gold standard and transitioned to a free-floating currency known as the Post Bretton Woods system. Below is a chart showing the decline of the USD against a basket of foreign currencies Post Bretton Woods. The red line represents January to June, 2025, the other gray lines represent January to June of prior years.
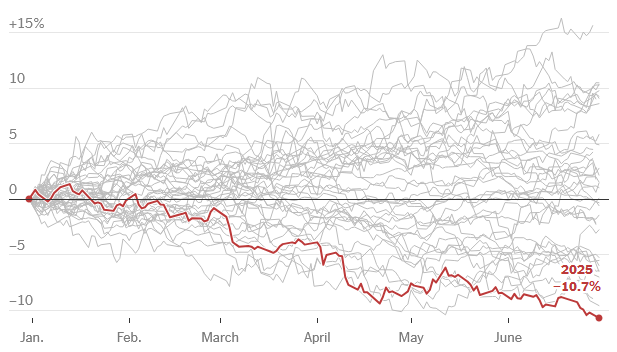
Figure 1: USD as measured against a basket of major currencies (Rennison, 2025)
Budget Bill
The spending bill, the One Big Beautiful Bill Act (H.R. 1), just passed into law. There are various social and economic provisions within. However, for our newsletter, we will only focus on the tax and deficit issues here. The bill extends the 2017 tax cuts originally set to expire at the end of 2025 and made the tax cuts permanent, but left entitlement programs (Social Security, Medicare, and Medicaid) relatively unchanged. The disproportionate winners are corporations, permanently lowering the tax rate to 21% from 35% before the 2017 tax cuts, and high-wage earners with income in excess of $500,000 in lower tax states. While the tax rate decrease benefits high-wage earners in higher tax states such as California, New Jersey, and New York, the limitations on state and local tax deductions increase the taxability of income levels. The Congressional Budget Office (CBO) estimates that the H.R. 1 will increase debt by $3 trillion over the next ten years and increase the deficit to 7% of Gross Domestic Product (GDP) (CBO, 2025). We believe 7% deficits and full employment are mutually exclusive; it does not seem possible to sustain both. The CATO Institute, a conservative think tank, projects that the increase in debt will be closer to $6 trillion (Lett, 2025). Either way, this is a fiscal bomb and economically unsustainable.
H.R. 1 will increase debt further over the next ten years. To substantially reduce the deficit, we must reduce spending on entitlement programs, Social Security, Medicare, and Medicaid. However, it is politically unviable to address this third rail issue. As a result, the CBO estimates that the debt to GDP ratio will increase to 150% by 2034. This is the same debt to GDP ratio as Greece during the Greek Financial Crisis in 2009 (Statista, 2025). If you recall, the fear at the time was the collapse of the Euro and a default in Greece. While our economic factors are different than Greece’s, the fear of structurally high debt is a concern for repayment, inflation, and long-term growth.
In 2009, Dr. Kenneth Rogoff and Dr. Carmen Reinhart published This Time is Different, Eight Centuries of Financial Folly. In the book, the pair examined the effect of excess debt accumulation on economic growth by examining government, bank, corporation, and consumer debt and the growth of the economy spanning sixty-six countries over five continents and eight centuries. It concluded that as debt levels increase, measured by debt to GDP, economic growth slows. Specifically, when debt exceeds 90% of GDP, growth slows significantly. The book urged politicians and policy-makers to continuously scrutinize economic policies with an eye toward history.
When the book came out in 2009, we were in the depths of the Great Recession. It prompted leaders around the world to scrutinize debt. Yet since 2009, the US debt to GDP ratio increased from 84% in 2009 to over 120% as of 2024. The ratio will continue to increase with the passing of H.R. 1. According to Rogoff and Reinhart’s study, we can anticipate much slower growth.
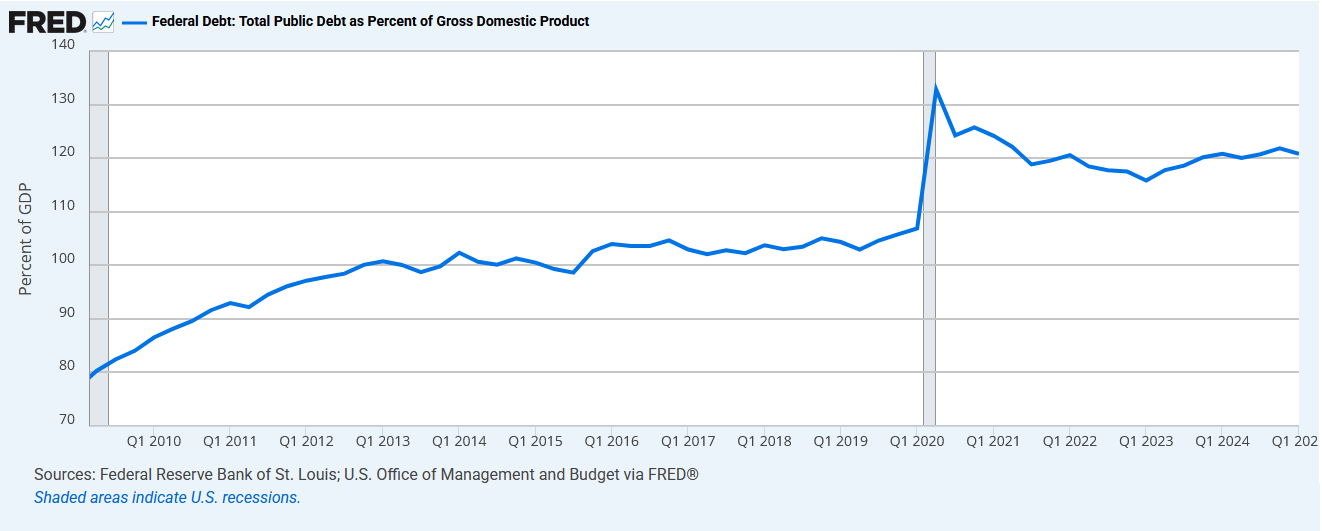
Figure 2: Public Debt as Percentage of GDP (FRED, 2025)
Is it this simple? When three Amherst economists, Herdon, Ash and Pollin, revisited the Rogoff and Reinhard study in 2013, the three found coding, math errors, and an “unconventional weighting of summary statistics” leading to an “inaccurate” representation between “the relationship between public debt and GDP growth.” (Herdon, 2013) In short, Herdon et al found that the Rogoff study failed to account for certain country data and equally weighted country GDP data. For example, New Zealand, a smaller country, was given the same weight as the United Kingdom, a country with a much larger economy. This weighting gave small GDP countries with large debt an outsized weighting in the study. This skewed the results. In short, the relationship between debt and GDP growth remains unclear. If you’re interested in reading more about the two studies, we enclosed the link to the study at the end.
We are clear on one thing: H.R. 1 will drastically increase borrowing over the next 10 years. This means the US will issue more debt in the form of Treasuries. In economics, because relationships between variables are complex, analyses are often conducted ceteris paribus, or holding all other things constant. The supply of Treasuries will increase, and holding demand the same, we will see higher longer-term interest rates, inflation, and further devaluation of the USD. The era of low interest rates may be behind us; it might be decades before we see sub 3% 30-year mortgages again, if at all.
On the tax front, H.R. 1 extends many of the taxpayer-friendly provisions of the Tax Cuts and Jobs Act (TCJA) passed in 2017: Individual Income Tax: Favorable individual income tax rates remain, with the top marginal income tax rate still at 37%. The SALT cap (State & Local Income Tax) increases to $40,000 from $10,000 and will increase by 1% each year beginning in 2026, reverting to $10,000 in 2030. The cap is reduced for taxpayers with a modified adjusted gross income of over $500,000 ($250,000 for single and married filing separately), although the cap will not fall below $10,000. The elimination of Miscellaneous Itemized deductions, the larger Standard Deduction and Alternative Minimum Tax exemption amounts remain. High-wage earners in lower-taxed states and itemizers with income less than $500,000 in higher-tax states benefit the most from these changes.
Business Tax: The bill restores and expands bonus depreciation, business interest deduction, Section 199A qualified business income (QBI) and expands benefits under Section 1202 Qualified Small Business Stock.
Estate & Gift Tax: The exemption amount for gift, estate and generation skipping transfer tax increases to $15 million for an individual or $30 million for a married couple (indexed to inflation).
Trump Accounts (“IRA’s” for Minors): The federal government will make a one-time contribution of $1,000 to an IRA like account for each child with a valid Social Security number born between Dec 1, 2025 and Dec 31, 2028. The “IRA” can receive up to $5,000 each year in contributions, indexed to inflation, and must be invested in a stock index fund. We will be watching out for how this will be implemented.
Thank You
As always, we greatly appreciate the confidence you have placed in us to work alongside you as you financially prepare for your future. We hope that you are staying healthy and taking care of yourself.
If you have any questions or concerns, please contact us and we will be happy to meet with you and review or refresh your overall plan. Follow us on Facebook, LinkedIn, and Twitter, as well as our RSS feed, to stay up to date on what we’re reading and thinking.
Citations:
If you have any questions or concerns, please contact us and we will be happy to meet with you and review or refresh your overall plan. Follow us on Facebook, LinkedIn, and Twitter, as well as our RSS feed, to stay up to date on what we’re reading and thinking.
Citations:
Cato.org, 2025,
www.cato.org/news-releases/senate-bill-could-increase-debt-6-trillion-cato-analysis#. Accessed 10 July 2025.
“CBO Estimates $3 Trillion of Debt from House-Passed OBBBA | Committee for a Responsible Federal Budget.” Committee for a Responsible Federal Budget, 4 June 2025, www.crfb.org/blogs/cbo-estimates-3-trillion-debt-house-passed-obbba.
FRED. “Federal Debt: Total Public Debt as Percent of Gross Domestic Product.” Stlouisfed.org, 2024, fred.stlouisfed.org/series/GFDEGDQ188S.
“Greece – National Debt in Relation to Gross Domestic Product (GDP) 2024.” Statista, www.statista.com/statistics/270413/national-debt-of-greece-in-relation-to-gross-domestic-product-gdp/.
Herndon, Thomas, et al. Does High Public Debt Consistently Stifle Economic Growth? A Critique of Reinhart and Rogoff. 15 Apr. 2013, peri.umass.edu/wp-content/uploads/joomla/images/WP322.pdf&ved=2ahUKEwiw9Oun8rKOAxWsI0QIHaMyAnoQFnoECBgQAQ&usg=AOvVaw1R4yg9p3j-YFvS9HqX_1IM.
Reinhart, Carmen M, and Kenneth S Rogoff. This Time Is Different : Eight Centuries of Financial Folly. Princeton, N.J. ; Woodstock, Princeton University Press, 2009.
Rennison, Joe. “The Dollar Has Its Worst Start to a Year since 1973.” The New York Times, 30 June 2025, www.nytimes.com/2025/06/30/business/dollar-decline-trump.html.